top of page

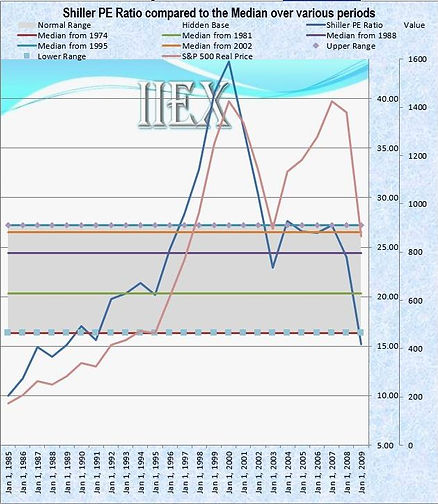
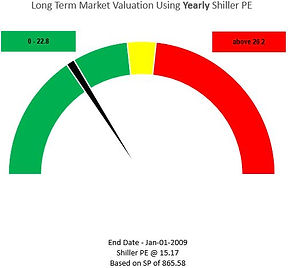
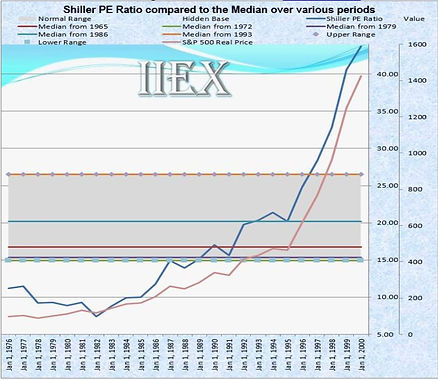
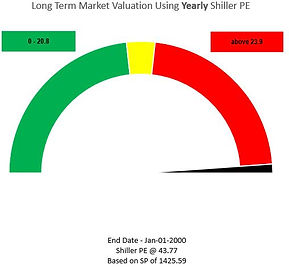
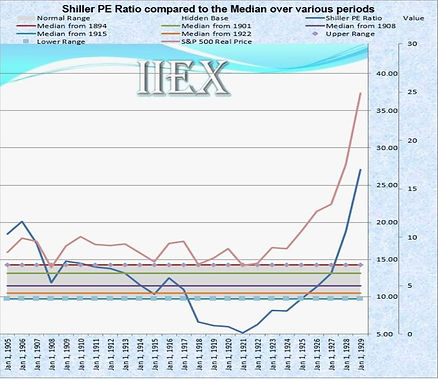
The "Normal Range" is calculated by establishing five medians (not averages) over intervals of eight years. Market valuation is reflected where the Shiller ratio (blue line) is at. The market gauge (to the right) reflects the point in time for the graph in question.
Below visuals include, 2009, 2000, and 1929.
2009
2000
1929


Cody-Klein Enterprises
bottom of page